Crab Nebula example for low zenith range
import astropy.units as u
import matplotlib.pyplot as plt

from datetime import datetime, timezone
from pathlib import Path

from astroplan import FixedTarget, Observer
from astropy.time import Time
from astropy.visualization import quantity_support
from ipywidgets import interact, DatetimePicker

from iact_estimator import RESOURCES_PATH
from iact_estimator.core import (
    calculate,
    initialize_model,
    prepare_data,
    source_detection,
)
from iact_estimator.io import read_yaml
from iact_estimator.observability import get_days_in_this_year, define_constraints
from iact_estimator.plots.physics import plot_sed, plot_spectrum
from iact_estimator.plots.observability import (
    create_observability_heatmap,
    plot_altitude_airmass,
    plot_transit,
)
from iact_estimator.plots.wobble_skymap import load_wobbles, plot_skymap_with_wobbles
output_path = Path.cwd()
config = read_yaml(RESOURCES_PATH / "config.yml")
source_name = "Crab"

observer = Observer.at_site("Roque de los Muchachos")

crab = FixedTarget.from_name(source_name)
plotting_options = config["plotting_options"]
use_seaborn = config["use_seaborn"]
if use_seaborn:
    import seaborn as sns

    seaborn_options = config["seaborn_options"]
    sns.set_theme(**seaborn_options)


assumed_spectrum = initialize_model(config)

plot_energy_bounds = [
    u.Quantity(plotting_options["min_energy"]),
    u.Quantity(plotting_options["max_energy"]),
]
Source transit
target_source = FixedTarget.from_name(source_name)
observer = Observer.at_site("Roque de los Muchachos")

date_time = DatetimePicker(
    value=datetime.now(timezone.utc), description="Select a datetime", disabled=False
)

crab = FixedTarget.from_name("Crab")
plot_crab = True if (crab.coord == target_source.coord) else False


def interactive_plot_transit(date_time):
    with quantity_support():
        plot_transit(
            config,
            source_name,
            target_source,
            observer,
            time=Time(date_time).utc,
            merge_profiles=True,
            plot_crab=False,
            savefig=False,
        )


interact(interactive_plot_transit, date_time=date_time)
plt.show()
Altitude and airmass
date_time = DatetimePicker(
    value=datetime.now(timezone.utc), description="Select a datetime", disabled=False
)


def plot_alt(date_time):
    print(date_time)

    plot_altitude_airmass(
        config,
        source_name,
        target_source,
        observer,
        time=Time(date_time).utc,
        brightness_shading=True,
        airmass_yaxis=True,
        savefig=False,
    )


interact(plot_alt, date_time=date_time)
plt.show()
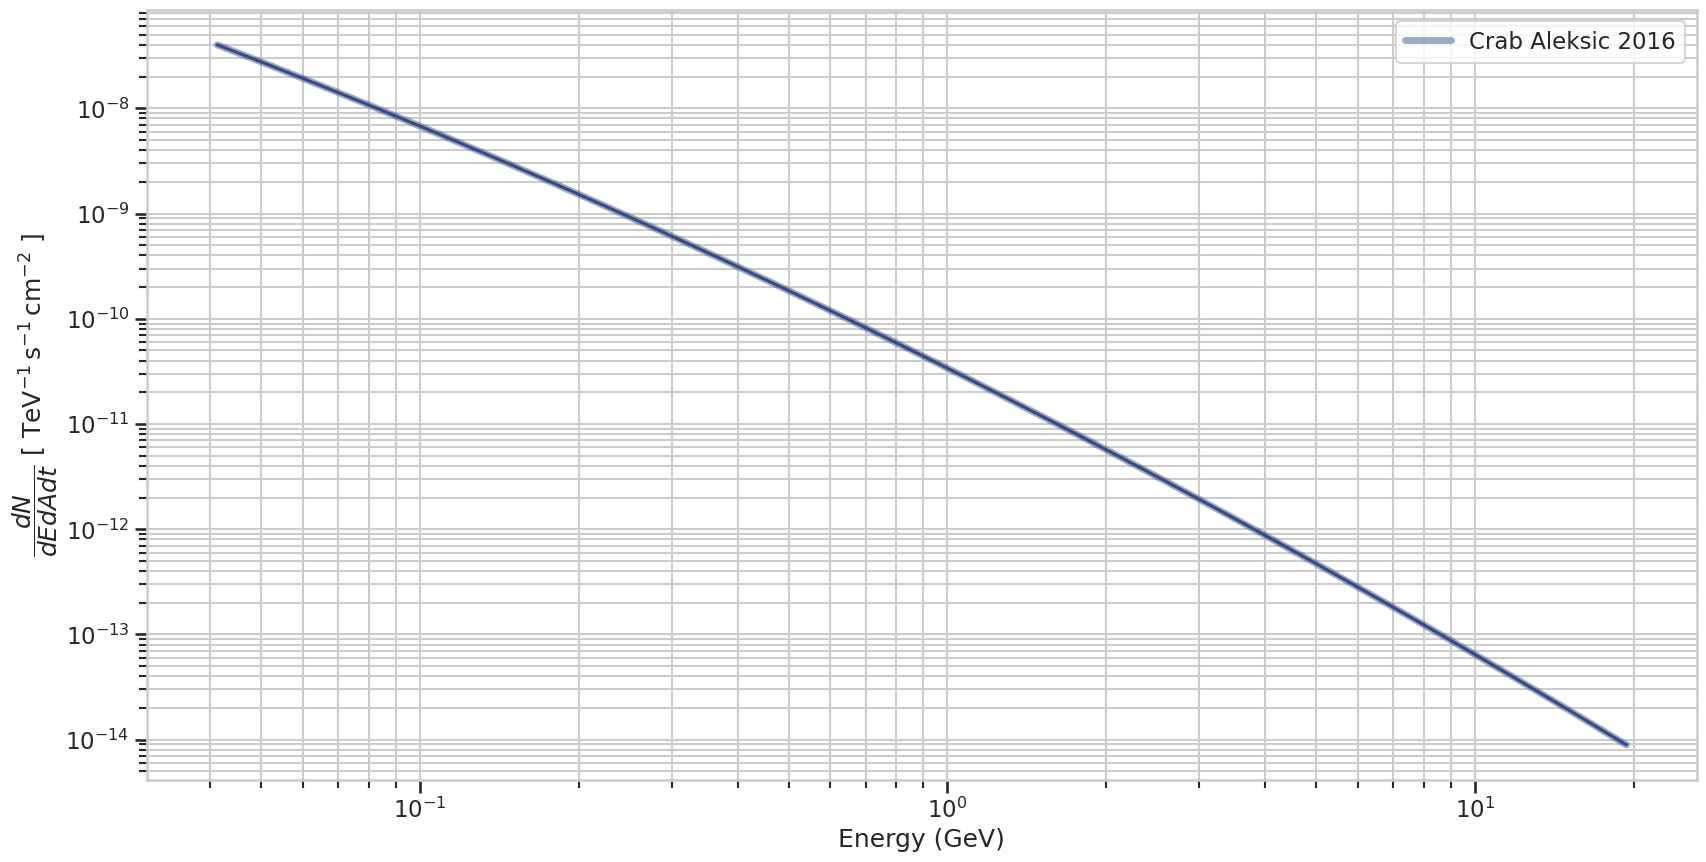
Spectrum
plot_spectrum(
    config,
    plot_energy_bounds,
    assumed_spectrum,
    source_name,
    plotting_options,
    savefig=False,
)
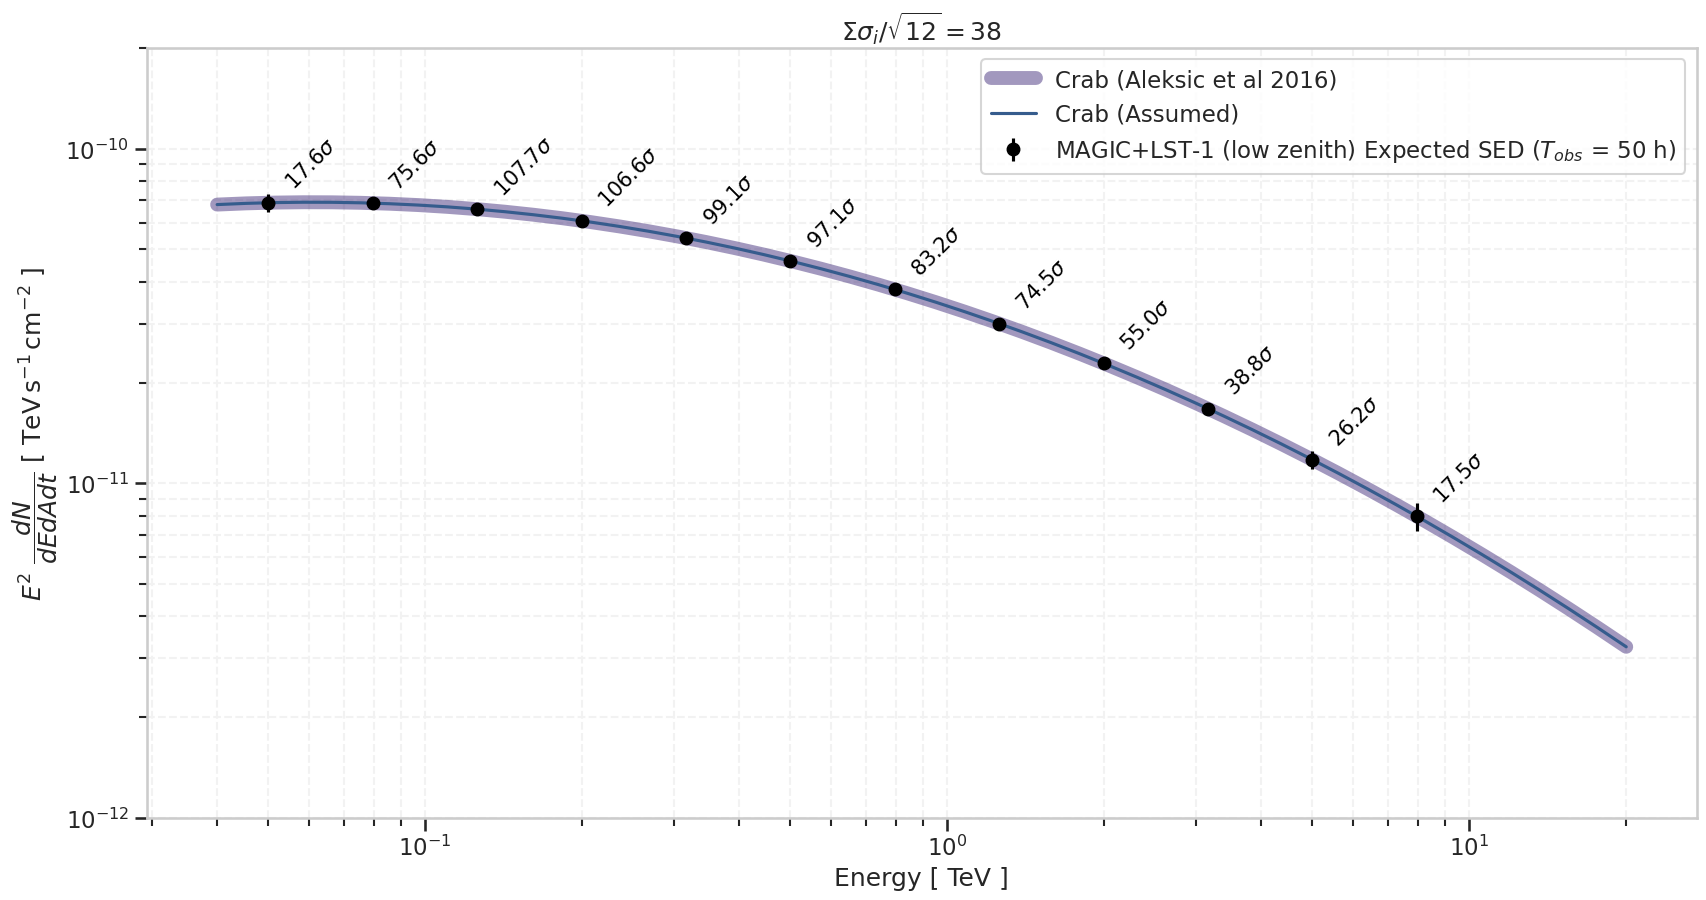
Estimated spectral energy distribution
energy_bins, gamma_rate, background_rate = prepare_data(config)

en, sed, dsed, sigmas, detected = calculate(
    energy_bins, gamma_rate, background_rate, config, assumed_spectrum
)

combined_significance = source_detection(
    sigmas, u.Quantity(config["observation"]["time"])
)
There are 14 energy bins
39.8 GeV-63.1 GeV GeV: exc. = 1138.5+-68.5 ev., SBR=42.70%, sigma = 17.6  DETECTION
63.1 GeV-100.0 GeV GeV: exc. = 7742.4+-119.8 ev., SBR=156.36%, sigma = 75.6  DETECTION
100.0 GeV-158.5 GeV GeV: exc. = 8477.1+-103.8 ev., SBR=489.82%, sigma = 107.7  DETECTION
158.5 GeV-251.2 GeV GeV: exc. = 4996.2+-72.1 ev., SBR=3278.09%, sigma = 106.6  DETECTION
251.2 GeV-398.1 GeV GeV: exc. = 3986.7+-63.8 ev., SBR=6475.81%, sigma = 99.1  DETECTION
398.1 GeV-631.0 GeV GeV: exc. = 3861.3+-62.8 ev., SBR=5926.42%, sigma = 97.1  DETECTION
631.0 GeV-1000.0 GeV GeV: exc. = 2650.2+-51.7 ev., SBR=15745.20%, sigma = 83.2  DETECTION
1000.0 GeV-1584.9 GeV GeV: exc. = 2113.5+-46.1 ev., SBR=17839.51%, sigma = 74.5  DETECTION
1584.9 GeV-2511.9 GeV GeV: exc. = 1172.4+-34.4 ev., SBR=12192.31%, sigma = 55.0  DETECTION
2511.9 GeV-3981.1 GeV GeV: exc. = 588.9+-24.4 ev., SBR=10860.91%, sigma = 38.8  DETECTION
3981.1 GeV-6309.6 GeV GeV: exc. = 267.0+-16.4 ev., SBR=12149.67%, sigma = 26.2  DETECTION
6309.6 GeV-10000.0 GeV GeV: exc. = 110.4+-10.5 ev., SBR=324171.95%, sigma = 17.5  DETECTION
10000.0 GeV-15848.9 GeV GeV: exc. = 0.0+-0.0 ev., SBR=nan%, sigma = 0.0
Combined significance (using the 12 data points shown in the SED) = >38
The source probably will be detected in 50.0 h.
/home/docs/checkouts/readthedocs.org/user_builds/iact-estimator/envs/41/lib/python3.11/site-packages/astropy/units/quantity.py:653: RuntimeWarning: invalid value encountered in divide
  result = super().__array_ufunc__(function, method, *arrays, **kwargs)
annotation_options = {"rotation": 45, "xytext": (10, 10), "size": 15}

with quantity_support():
    plot_sed(
        config,
        sigmas,
        combined_significance,
        source_name,
        assumed_spectrum,
        en,
        sed,
        dsed,
        detected,
        savefig=False,
        annotation_options=annotation_options,
    )
    plt.ylim(1.0e-12, 2.0e-10)
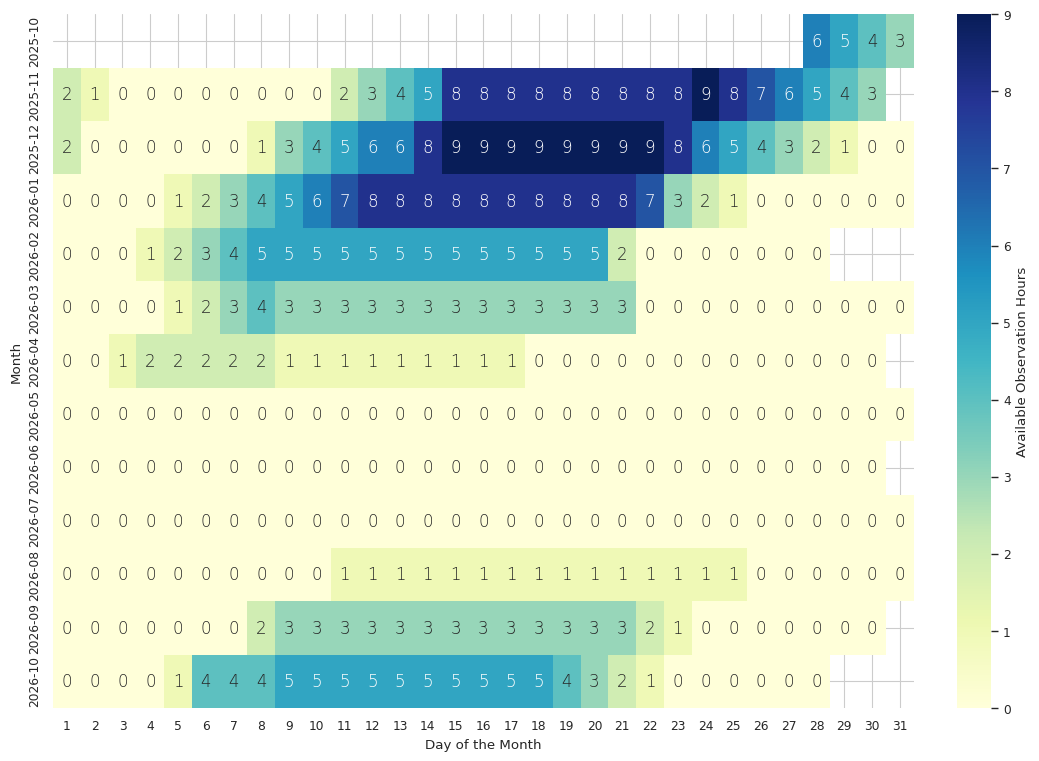
Observability heatmap
constraints = define_constraints(config)

start_datetime = (
    Time(config["observation"]["start_datetime"])
    if config["observation"]["start_datetime"] is not None
    else Time(datetime.now(tz=observer.timezone))
)
year_days = get_days_in_this_year()
end_datetime = (
    Time(config["observation"]["end_datetime"])
    if config["observation"]["end_datetime"] is not None
    else start_datetime + year_days
)

create_observability_heatmap(
    target_source,
    observer,
    constraints,
    start_datetime,
    end_datetime,
    time_resolution=1 * u.hour,
    cmap="YlGnBu",
    sns_plotting_context="paper",
    sns_axes_style="whitegrid",
    savefig=True,
    output_path=None,
    save_format="png",
)
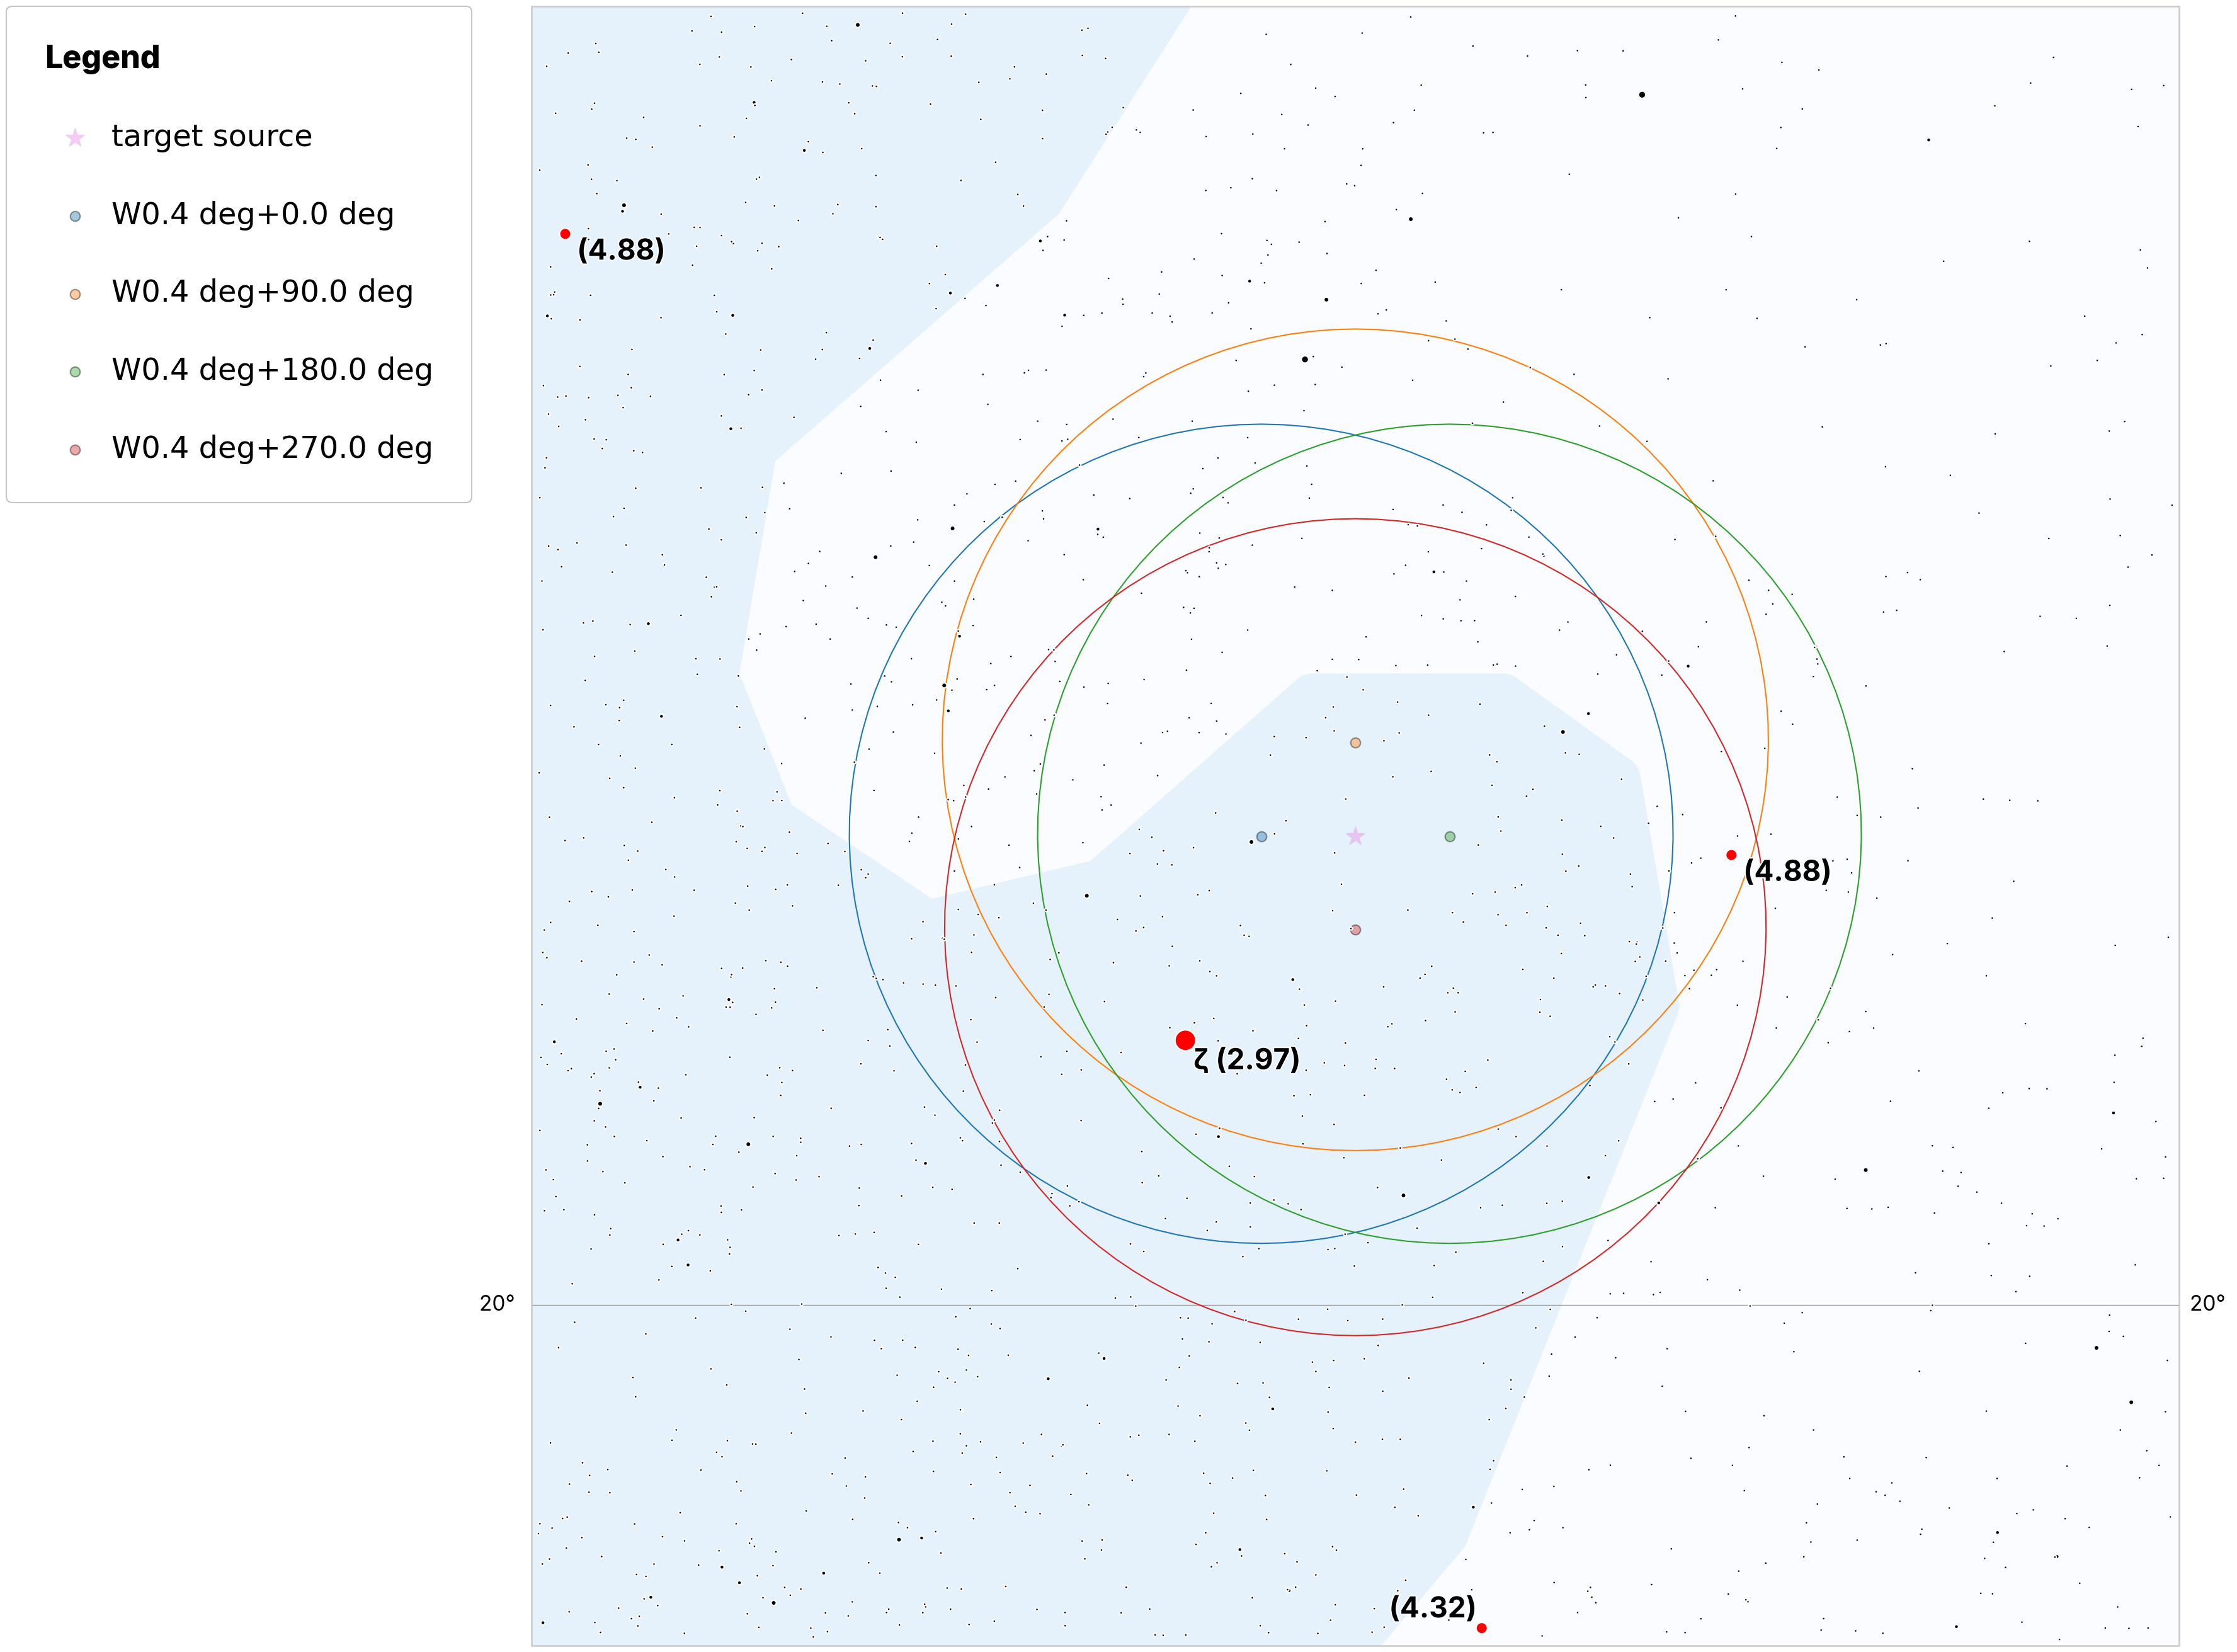
Pointing strategy
config = read_yaml(RESOURCES_PATH / "config.yml")

# you can override at runtime any part of the config
# e.g. this section corresponds to
# https://starplot.dev/reference-styling/#starplot.styles.LegendStyle
config["wobble_skymap_plot_options"]["legend"] = {
    "alignment": "left",
    "location": "outside left upper",
    "padding_x": -500,
    "num_columns": 1,
}

instrument_fov = u.Quantity(config["fov"])
wobble_offsets, wobble_angles = load_wobbles(config["wobbles"])
plot_skymap_with_wobbles(
    target_source,
    observer,
    instrument_fov,
    wobble_angles,
    wobble_offsets,
    config,
)
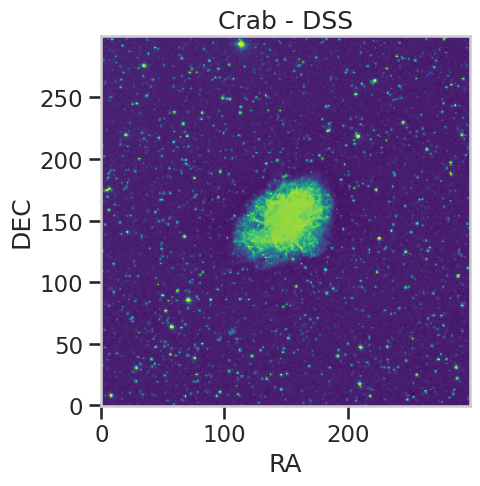
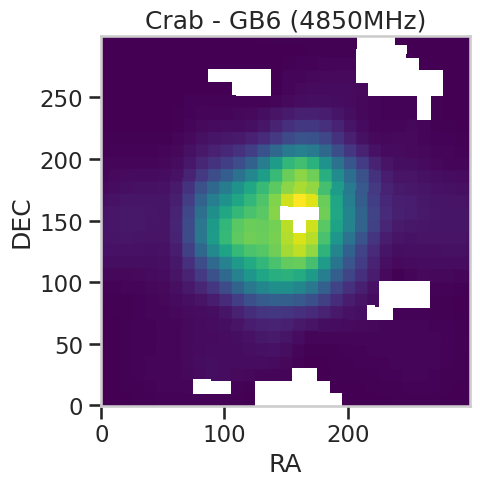
Skymaps from Skyview
from iact_estimator.plots.multi_wavelength import plot_from_skyview_survey

for survey in config["skyview"]["surveys"]:
    survey_name = survey["name"]
    fig, ax = plt.subplots()
    ax, hdu = plot_from_skyview_survey(
        target_source,
        survey_name=survey_name,
        fov_radius=u.Quantity(survey["fov_radius"]),
        log=survey["log"],
        ax=ax,
        reticle=survey["reticle"],
        style_kwargs=survey["style_kwargs"],
        reticle_style_kwargs=survey["reticle_style_kwargs"],
    )
    ax.set_title(f"{source_name} - {survey_name}")
    output_path = output_path if output_path is not None else Path.cwd()
    fig.savefig(
        output_path
        / f"{source_name}_{survey_name}.{config['plotting_options']['file_format']}",
        bbox_inches=config["plotting_options"]["bbox_inches"],
    )
WARNING: FITSFixedWarning: 'datfix' made the change 'Set MJD-OBS to 47944.000000 from DATE-OBS.
Changed DATE-OBS from '22/02/90' to '1990-02-22''. [astropy.wcs.wcs]